
HF Propagation
Propagation of shortwave radio signals around the world is vitally important to radio operators. We use the ionosphere to reflect our signals back and forth between ionised layers, hundreds of kilometres above the earth, and the ground. The process is called skip and is powered entirely by the sun. Without the sun, amongst other things, we wouldn't be able to send radio signals much beyond the horizon. There are, of course, many on-line resources to explore this fascinating phenomenon. They provide space weather reports, indices and forecasts. For starters, we recommend having a look at the Australian Space Weather Forecasting Centre at https://www.sws.bom.gov.au/. In addition to this, radio operators publish their own information via on-line databases such as pskReporter and WSPRnet. However, we found that some of the important data available is only displayed as a snapshot in time. Because of the sun's diurnal influence, radio propagation changes dramatically between daytime and nighttime. To try to understand the daily effects of the ionosphere and radio propagation we needed more dynamic views. This page provides our attempts at capturing relevant information over a 24-hour period and displaying it as a short video.
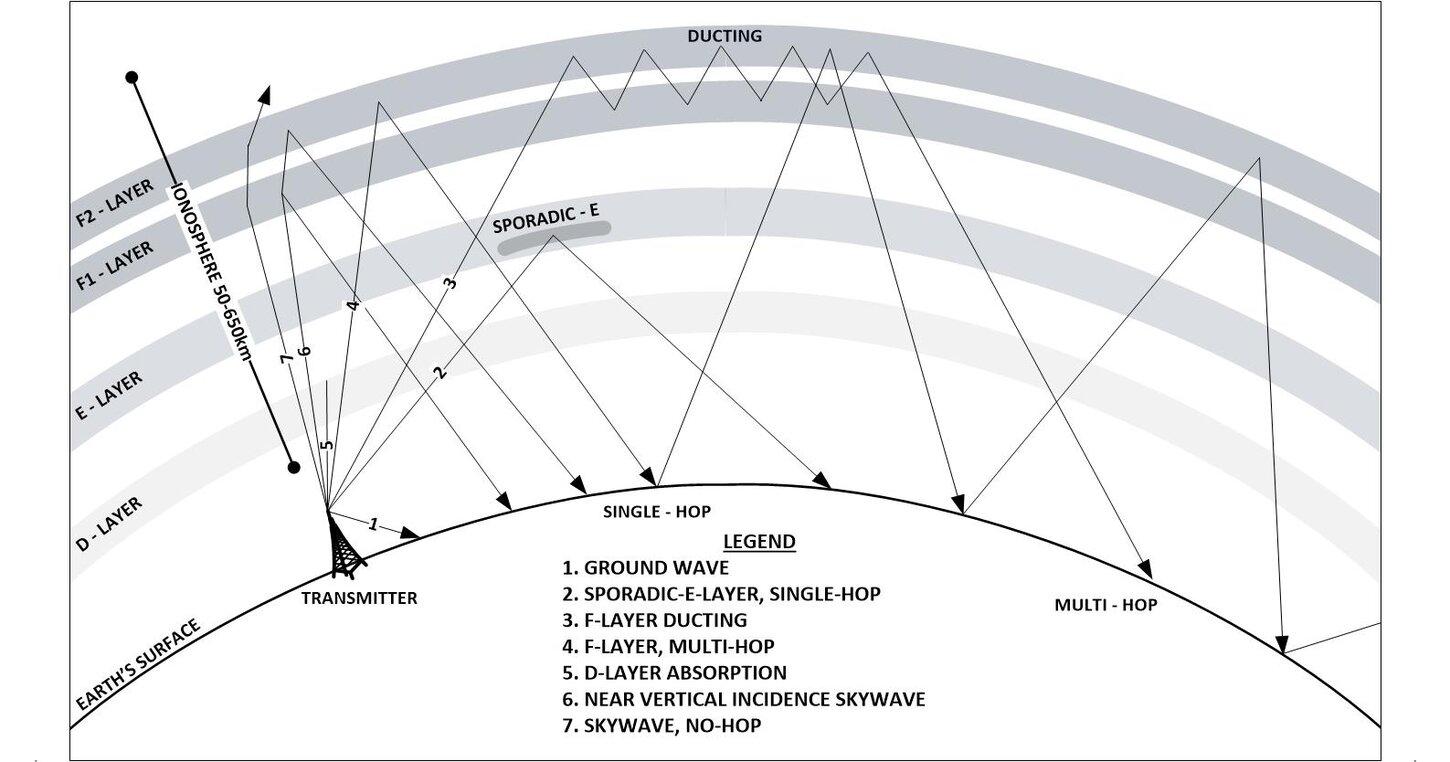 Types of Ionospheric Propagation
See also our HF Propagation activity here.
Ionogram Video Creator
Ionograms are radio-frequency soundings of the earth’s ionosphere. They are plots of the intensity, height and frequency of radio echos returned from the sky above meteorological ground stations equipped with an ionosonde installation.
Discussion of the creation, interpretation and use of ionograms is way beyond the scope of this page. Suffice to day, however, that ionograms can be very useful in understanding the mechanisms of shortwave radio propagation. Thankfully, there is a plethora of information about ionograms on the Internet. Of interest here, though, is that the characteristics of ionosphere change dramatically during the day and night and a sequence of ionograms can provide a far more dynamic view of this very interesting phenomenon.
The software, ionogram.exe, was designed to compress the ionograms taken at 5-minutes intervals over a 24-hour period from a given station, into a one-minute video.
This program:
- Allows the user to select the specific ionosonde site and the day of interest for the creation of an ionogram video;
- downloads the relevant ionogram data files from the Australian Space Weather Forecasting Centre over the Internet;
- plots the ionogram data, creating some 288 ionogram image files; and finally
- assembles the images into a video.
Acknowledgement and Conditions of Use
This project would not have been possible without the provision of highly processed and clean, ionosonde data available from the Australian Space Weather Forecasting Centre, to be found at www.sws.bom.gov.au/World_Data_Centre. The authors are grateful to the ASWFC for releasing this data into the public domain. Please visit the site to review the conditions of using this data.
Requirements
You will need:
- A PC running Microsoft® Windows10™ or Windows11™
- An internet connection
- Around 25MB free disk space to produce each daily ionogram video
- A PDF Reader app
Installation
Download the installer from www.sarcnet.org/files/SetupIonogram.exe. Go to your Downloads folder and double-click it to run the SetupIonogram application. After installation, the Ionogram application can be found in your Documents/Ionogram folder. A desktop shortcut icon is also created. You can pin that icon to the start menu and/or to the task bar.

An ionogram taken from
Canberra as shown by the ASWFC Ionogram Viewer

Basic interpretation of an
ionogram showing the minimum height and critical frequencies of the
so-called E, F1 and F2 ionospheric layers

The application window
showing the creation of the ionogram video

Our own ionogram image file. Compare this with the ionogram from the ASWFC viewer above.
Download a sample Ionogram video here.
pskReporter Video Creator
In progress.
WSPRnet Video Creator
Not started.
